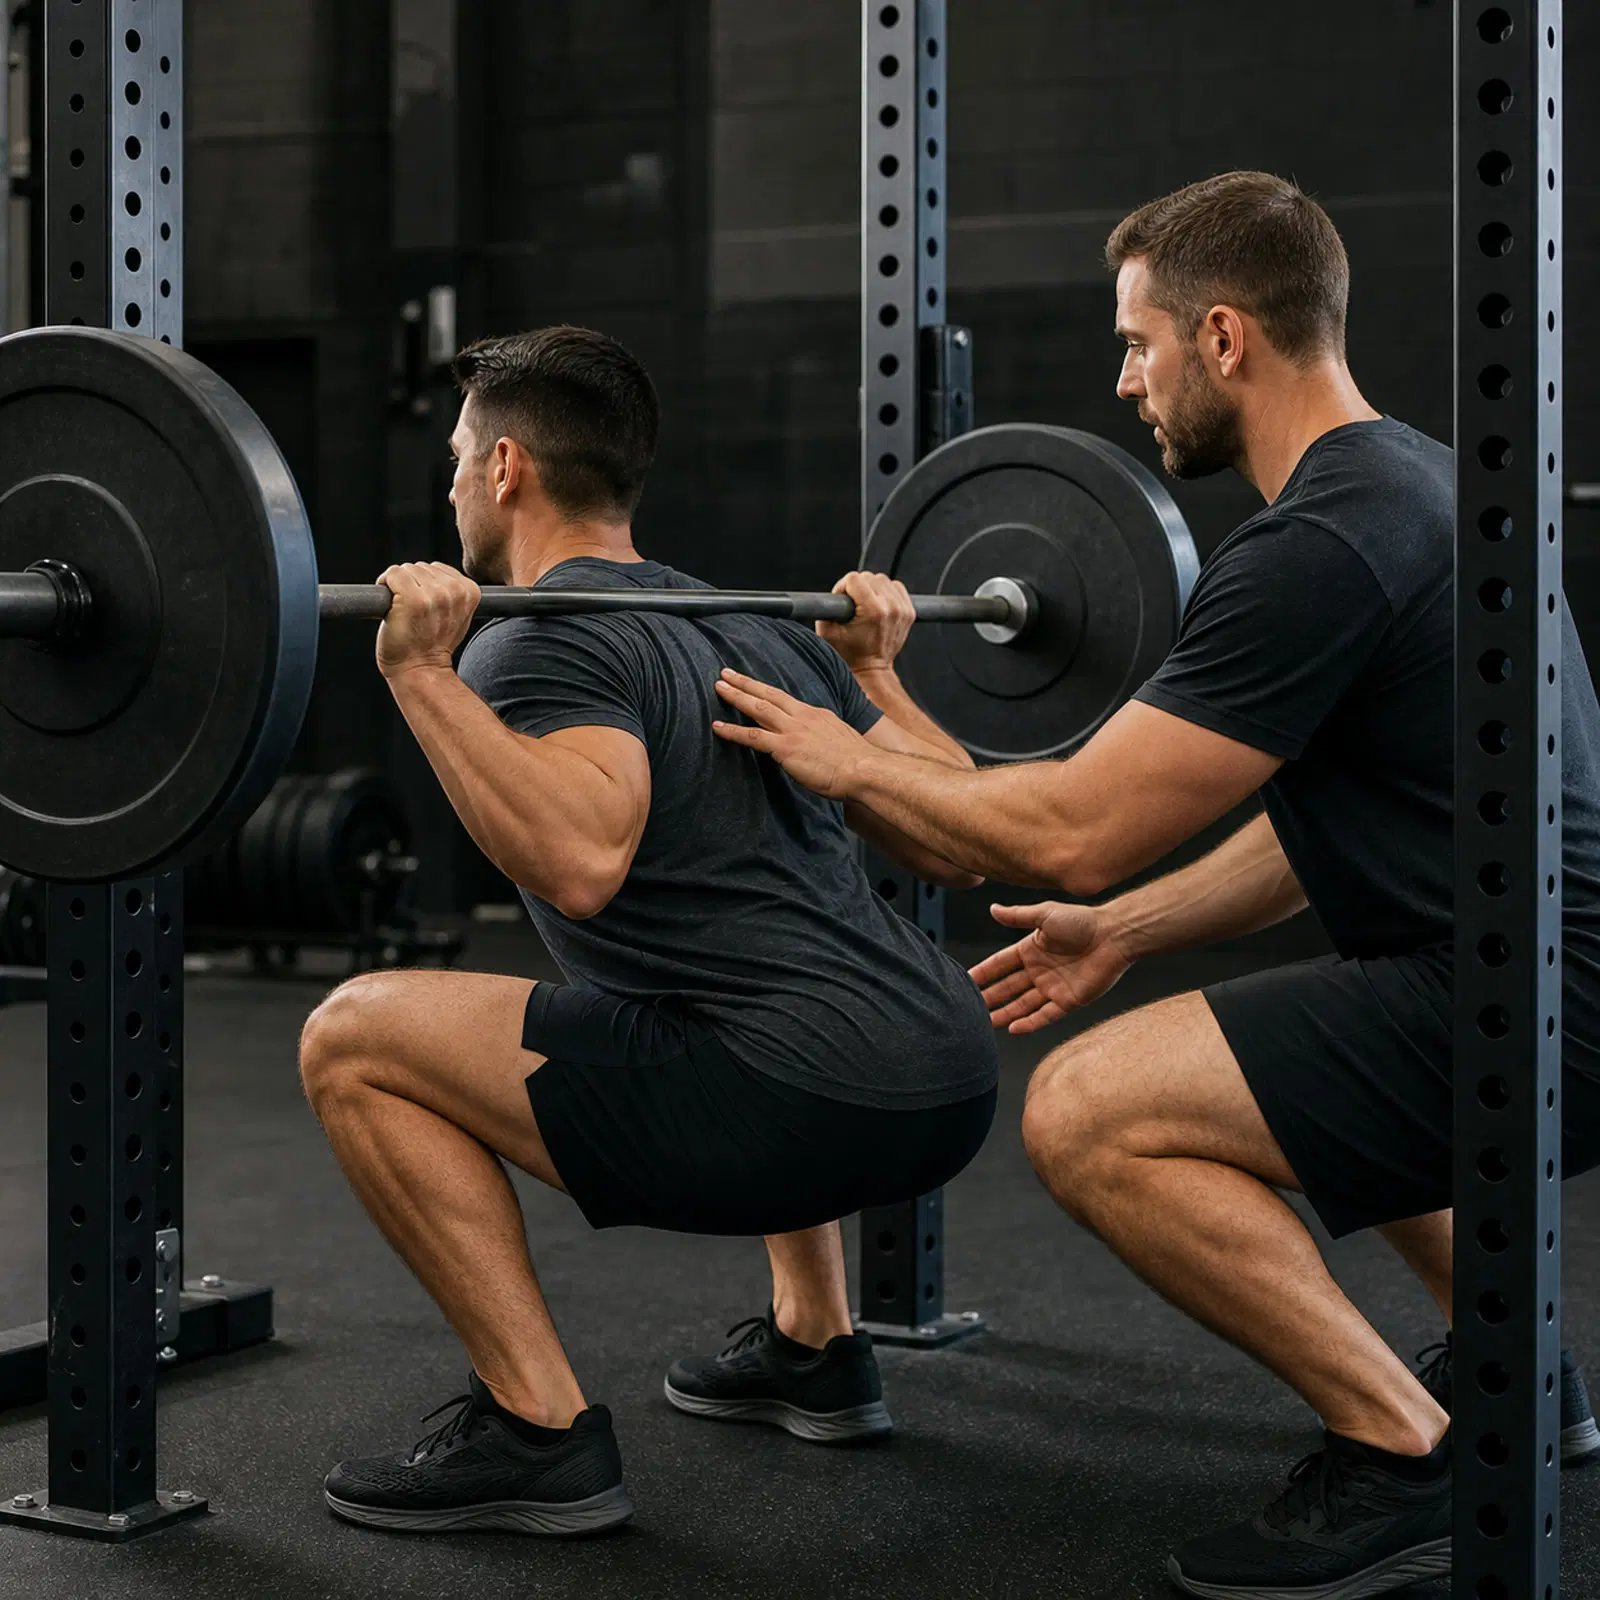
Track the few numbers that change decisions. Trends beat single readings; logging everything beats nothing only if you use it.
What do you want to do?
Start here
4 lessons · ~8 min · in this order- 1Leading vs Lagging IndicatorsLeading indicators are the controllable behaviors that predict results (workouts done, nutrition adherence); lagging indicators are the slow outcomes they produce (weight, strength, FTP).Begin →
- 2What to Log for Strength TrainingFor every resistance set, capture the exercise, the load, reps completed, and effort — these four fields make a strength log analyzable.2 min
- 3Trend vs NoiseAlmost every fitness metric jiggles day to day from causes unrelated to real progress — the skill is reading the underlying trend through that noise instead of reacting to single points.2 min
- 4When a Metric Signals "Adjust the Program"Change the program when a noise-cleared trend misses its target for long enough — and only after ruling out adherence as the real cause.2 min
Every Tracking topic
59 topics
- Active Minutes2 minMetric · Minutes spent at moderate-to-vigorous intensity — the metric that maps directly onto public-health activity guidelines.
- Adherence Tracking2 minMetric · Tracking how consistently you actually do the plan — workouts hit, nutrition days on-target — is the leading indicator that predicts results before the scale or the bar moves.
- Avoiding Over-Tracking and Obsession2 minConcept · Tracking should serve your training and well-being, not rule them — when the data causes anxiety, distorts behavior, or becomes the goal itself, measure less.
- Body Metrics Overview2 minConcept · No single body metric tells the whole story — combine weight trend, girths, body-fat estimate, and photos to read composition change correctly.
- Body-Fat Estimates2 minMetric · Every consumer body-fat method is an estimate with real error — trust the trend from one consistent method, not the absolute number.
- Bodyweight Tracking2 minMetric · Weigh consistently and trend the weekly average — a single daily reading is mostly noise; the smoothed trend is the real signal.
- Building a Simple Dashboard2 minMethod · A good dashboard shows a few goal-relevant metrics as smoothed trends — leading indicators for action, lagging indicators for confirmation — and hides the rest.
- Cadence2 minMetric · Cadence is movement rate — steps/min running, rpm cycling, strokes/min rowing or swimming — a form and efficiency signal that complements pace and power.
- Calorie and Macro Logging2 minMethod · Logging intake (calories and protein/carb/fat) makes the energy-balance side of progress visible — but it's an estimate, so trust the bodyweight trend to calibrate it.
- Calories Burned (Estimates)2 minMetric · Every device "calories burned" number is a rough estimate — useful for relative trends, but not accurate enough to budget your diet against.
- Cardio Efficiency (Pace/Power at HR)2 minMetric · Output at a fixed heart rate — faster pace or higher watts for the same HR over time — is the cleanest field signal that aerobic fitness is improving.
- Cardio RPE and Session RPE2 minMetric · Perceived effort (Borg 6–20 or 0–10) needs no device, and session-RPE × duration yields a simple, validated whole-session training-load number.
- Counting Hard Sets2 minMetric · Counting weekly hard sets (sets taken near failure) per muscle group is a simple, evidence-aligned dose unit for hypertrophy.
- Elevation Gain2 minMetric · Total vertical climbed reframes how hard a given pace really was — without it, hilly and flat sessions look falsely comparable.
- Estimated 1RM Trend2 minMetric · Convert each working set into a predicted one-rep max so heavy triples, fives, and tens land on one strength scale you can trend over time.
- Floors Climbed1 minMetric · A barometric estimate of vertical floors ascended — a small bonus activity metric that nudges toward harder incidental movement.
- Food Diary (Non-Numeric Logging)2 minMethod · Writing down what you eat — without counting calories — builds awareness and adherence, and the act of recording itself tends to improve choices.
- Girth (Circumference) Measurements2 minMetric · Tape-measure girths track where size changes are happening — and waist circumference is a meaningful health marker on its own.
- Goal-Setting with Metrics (SMART)2 minMethod · Turn vague aims into SMART goals — Specific, Measurable, Achievable, Relevant, Time-bound — and pair each outcome goal with the process goals you actually control.
- GPS Distance and Accuracy2 minConcept · GPS gives good-enough distance and pace outdoors, but multipath, tree cover, and tunnels introduce error — and vertical (elevation) error is worse than horizontal.
- Health-Data Privacy Basics2 minConcept · Fitness and health data is sensitive and often not covered by medical-privacy laws — know who can see it, where it's stored, and what you're consenting to share.
- Heart-Rate Variability (HRV)2 minMetric · HRV is the tiny beat-to-beat timing variation in your heart rate; higher (vs your own baseline) generally signals good recovery, lower signals stress or fatigue.
- How Often to Measure2 minMethod · Match measurement frequency to how fast each metric actually changes — daily for noisy fast signals you'll average, weekly to monthly for slow ones, periodically for fitness re-tests.
- HR Monitor Accuracy (Chest vs Optical)2 minConcept · Chest straps read the heart's electrical signal and are the more accurate reference; wrist optical sensors are convenient and usually close at rest but err more during intense or wrist-moving exercise.
- Interpreting Weight Fluctuations2 minConcept · Day-to-day scale swings are mostly water, glycogen, gut contents, and sodium — not fat gain or loss, which changes slowly.
- KPIs for Endurance2 minConcept · Track weekly training volume and intensity distribution as the inputs, and pace-at-HR / FTP / efficiency as the outputs that confirm aerobic fitness is rising.
- KPIs for Fat Loss2 minConcept · Track the bodyweight trend + waist + photos to confirm fat is leaving, and nutrition adherence + step floor as the controllable inputs driving it.
- KPIs for General Health2 minConcept · For general health, track that you're meeting activity guidelines (active minutes, strength days, steps) and watch simple health markers — RHR, sleep, waist — rather than performance numbers.
- KPIs for Hypertrophy2 minConcept · Track weekly hard sets per muscle and that they're progressing, plus slow gains in girths, photos, and a controlled scale rise — muscle is built by progressive volume and confirmed slowly.
- KPIs for Strength2 minConcept · The headline strength KPI is the estimated-1RM trend on your main lifts; behind it, track that load is progressing at controlled effort (RPE/RIR) over the block.
- Leading vs Lagging Indicators2 minConcept · Leading indicators are the controllable behaviors that predict results (workouts done, nutrition adherence); lagging indicators are the slow outcomes they produce (weight, strength, FTP).
- Logging Heart Rate (Avg / Max)2 minMetric · Average and max HR turn a session into an internal-load measure — how hard your cardiovascular system actually worked, independent of pace.
- Logging Rest Taken1 minMetric · Recording actual rest between sets explains performance swings and lets you track training density honestly.
- Logging RPE and RIR2 minMetric · RPE (effort 1–10) and RIR (reps left in the tank) are the effort fields that turn a load×reps log into an auto-regulatable one.
- Menstrual-Cycle Tracking2 minMethod · Logging cycle phase alongside training and body metrics explains predictable swings in weight, symptoms, and how you feel — and can inform (not dictate) training choices.
- Moving Averages2 minMethod · A moving average replaces each noisy daily reading with the average of a recent window, turning a jagged metric into a readable trend line.
- NEAT (Non-Exercise Activity Thermogenesis)2 minConcept · NEAT is all the energy you burn moving that isn't formal exercise — walking, fidgeting, posture, chores — and it's a large, variable slice of daily burn that quietly drives fat-loss results.
- Pace, Speed, and Distance2 minMetric · Pace (time per distance) and speed (distance per time) are the same intensity expressed two ways — but raw pace must be read against terrain and conditions.
- Personal Records (PRs)2 minMetric · A PR is any all-time best the system auto-detects from your log — a top load, rep count, estimated 1RM, distance, or fastest time.
- Power and FTP2 minMetric · Power (watts) is the most objective cardio intensity metric — instant, terrain-immune — and FTP is the threshold anchor its zones are built on.
- Progress Photos1 minMethod · Standardized photos catch visual change the scale misses — but only if lighting, pose, time, and angle are held constant.
- Rate-of-Change Targets2 minMethod · Set a target speed of change — e.g. lose 0.5–1% of bodyweight per week — then steer intake/training so the smoothed trend matches it.
- Readiness, Recovery, and Strain Scores2 minConcept · These single numbers blend HRV, resting HR, sleep, and recent load against your own baseline — useful directional nudges, but proprietary, baseline-relative, and not to be obeyed over how you feel.
- Resting Heart Rate (RHR)2 minMetric · Beats per minute fully at rest — a cheap fitness and recovery marker; a sustained rise above your baseline flags fatigue, stress, or illness.
- Sleep Tracking2 minMetric · Track sleep duration and consistency first; treat wearable "stage" breakdowns as rough, and judge quality mostly by how you feel and function.
- Steps2 minMetric · Daily step count is a simple, motivating proxy for overall movement — useful as a trend and an activity floor, not as a precise dose of exercise.
- Subjective Readiness Ratings (Mood / Energy / Soreness)2 minMetric · A 10-second daily self-rating of mood, energy, sleep, soreness, and stress is cheap and, in research, tracks training stress at least as well as expensive sensors.
- Time-in-Zone2 minMetric · The minutes you spend in each intensity zone — the metric that verifies whether your easy days were easy and your hard days hard.
- Tonnage1 minMetric · Tonnage is the total weight moved in a session (Σ reps × load across all sets and exercises) — a coarse whole-workout workload number.
- Training Density1 minMetric · Density is work done per unit time (volume load ÷ session minutes) — raise it by shrinking rest at equal volume to overload without adding weight.
- Training Volume Load2 minMetric · Volume load = sets × reps × load — the total mechanical work proxy that, trended over weeks, is the clearest single signal of training progress.
- Training-Load Monitoring (Acute:Chronic)2 minMethod · Quantify how much training you're doing — internally (sRPE, HR) and externally (volume, distance) — and watch how fast load is ramping relative to what you're used to.
- Trend vs Noise2 minConcept · Almost every fitness metric jiggles day to day from causes unrelated to real progress — the skill is reading the underlying trend through that noise instead of reacting to single points.
- Volume-Progression Tracking2 minMethod · Tracking whether weekly training volume (and the load behind it) is actually trending up over a block is how you verify progressive overload is happening, not just intended.
- Wearable Accuracy and Its Limits2 minConcept · Wearables are good at some things (steps, heart rate at rest) and weak at others (calorie burn, sleep stages) — trust their trends over their absolute numbers.
- Weighing vs Estimating Food2 minConcept · Weighing food is the most accurate intake method but the highest effort and obsession risk; hand-portion estimation is far rougher but sustainable — pick by goal and temperament.
- What to Log for Cardio2 minMethod · A cardio session is described by duration, distance, pace, heart rate, time-in-zone, power, cadence, elevation, and effort — log what your modality and goal actually use.
- What to Log for Strength Training2 minMethod · For every resistance set, capture the exercise, the load, reps completed, and effort — these four fields make a strength log analyzable.
- When a Metric Signals "Adjust the Program"2 minMethod · Change the program when a noise-cleared trend misses its target for long enough — and only after ruling out adherence as the real cause.
Explore connections
How Tracking links to other categories — line thickness is link density in the graph, not an editorial rating.